Calculating portfolio risk is something most investors do once — when they first build their portfolio. But that’s exactly the problem.
They pick a mix of assets, decide they’re comfortable with moderate risk, and move on. What they don’t account for is what happens next.
Over months and years, your portfolio quietly shifts. Equity grows faster than debt. One sector outperforms another. You add a fund here, skip a rebalance there. Slowly, without any single dramatic decision, your portfolio drifts into a riskier position than you ever intended.
This is called allocation drift. And according to research by Vanguard, unmanaged portfolio drift can increase a portfolio’s equity exposure by 10–20 percentage points over a 5-year period — significantly beyond what most investors planned for.
The result? A portfolio that looks familiar on the surface but carries far more risk underneath than the investor realises.
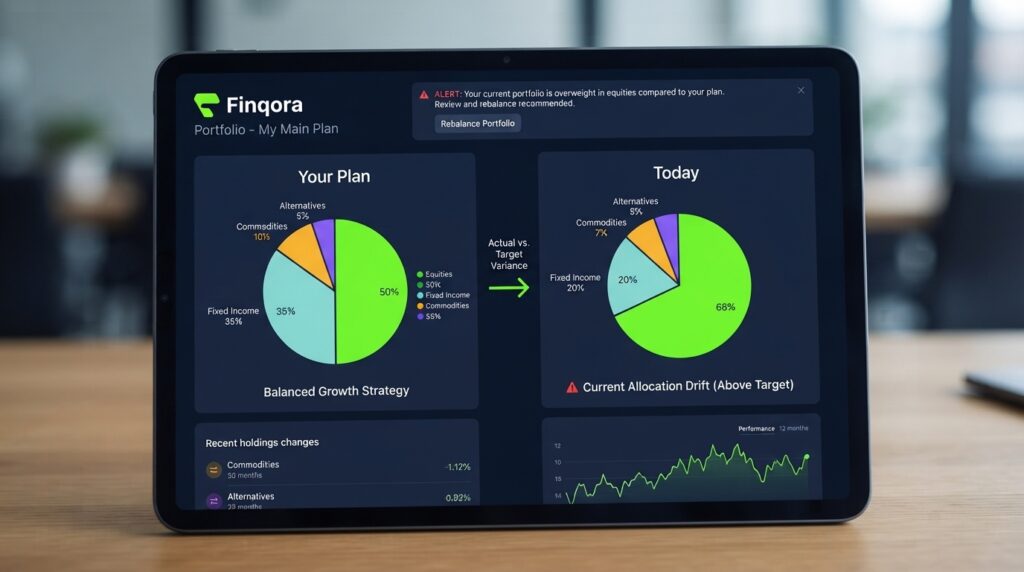
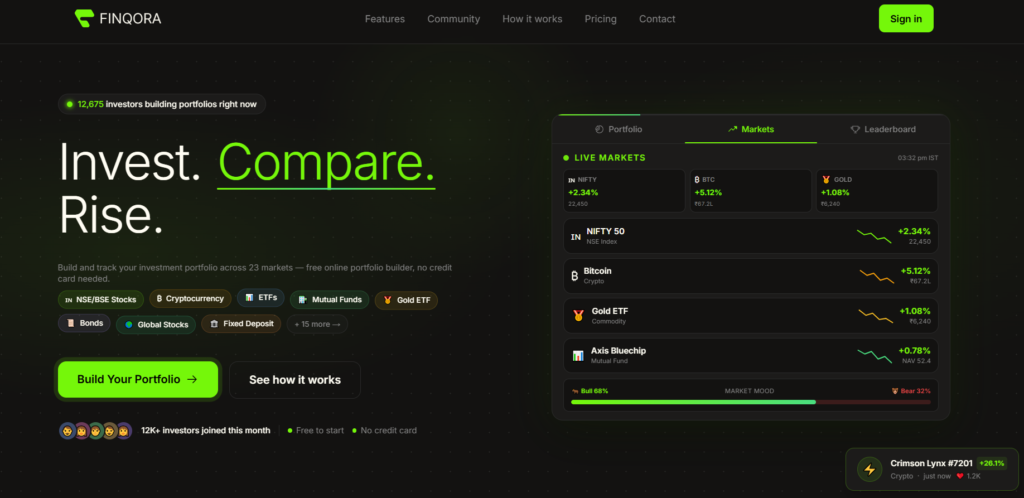
calculating portfolio risk using allocation drift detection on Finqora dashboard
What Is Allocation Drift — And Why Does It Happen?
When you first build a portfolio, you set a target allocation. Maybe it’s 60% equity and 40% debt. Or 50% mutual funds, 30% stocks, and 20% gold and fixed deposits.
That target reflects your risk tolerance at a specific point in time.
But markets don’t stay still. Equity markets have historically outperformed debt over the long term. This means that in a growing market, your equity allocation naturally increases — not because you made a decision to increase it, but simply because it grew faster than everything else.
A Real Example of Allocation Drift
Here’s exactly what this looks like in practice:
| Timeline | Equity Value | Debt Value | Total Portfolio | Equity % | Debt % |
|---|---|---|---|---|---|
| January 2023 (Start) | ₹3,00,000 | ₹2,00,000 | ₹5,00,000 | 60% | 40% |
| June 2023 (6 months) | ₹3,30,000 | ₹2,04,000 | ₹5,34,000 | 62% | 38% |
| January 2024 (1 year) | ₹3,55,000 | ₹2,08,000 | ₹5,63,000 | 63% | 37% |
| June 2024 (18 months) | ₹3,80,000 | ₹2,10,000 | ₹5,90,000 | 64% | 36% |
The investor never made a single new decision. But their risk exposure increased meaningfully — without them noticing. Multiply this across a 5 or 10-year period, across multiple asset classes and funds, and the drift becomes very significant.
How Allocation Drift Increases Your Portfolio Risk
Allocation drift increases risk in three specific ways that most investors don’t account for when calculating portfolio risk:
1. Concentration Risk Increases
As one asset class grows disproportionately, your portfolio becomes increasingly concentrated in that area. A portfolio that was once spread across 5 sectors may effectively be 65% dependent on the performance of 2.
A 2023 study by Morningstar found that investors who didn’t rebalance annually ended up with sector concentrations 30–40% higher than their original target allocation.
2. Correlation Assumptions Break Down
One of the foundations of calculating portfolio risk is the assumption that different assets move independently of each other. But as drift pushes you into higher equity concentration, previously uncorrelated assets start behaving more similarly — especially during market downturns, when correlations between equity assets tend to spike.
3. Risk Tolerance No Longer Matches Your Portfolio
Your risk tolerance is personal — tied to your goals, your timeline, your income, your psychology. But if your portfolio has drifted significantly, it may be carrying a risk profile that belongs to a different type of investor entirely.
| Risk Profile | Intended Equity % | Drifted Equity % (After 3 Years) | Risk Category Change |
|---|---|---|---|
| Conservative | 30% | 42% | Conservative → Moderate |
| Moderate | 50% | 64% | Moderate → Aggressive |
| Aggressive | 70% | 80% | Aggressive → High Risk |
This mismatch — between what your portfolio is doing and what you think it’s doing — is perhaps the most underappreciated risk of all.
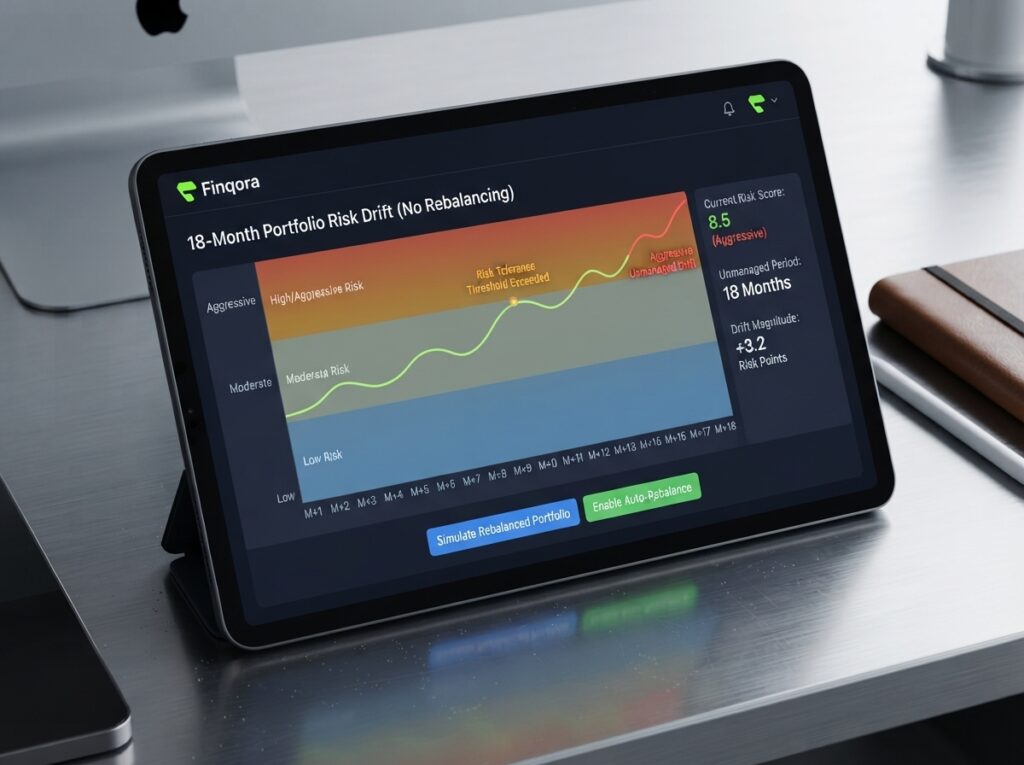
The Numbers Behind the Risk You’re Not Seeing
Calculating portfolio risk without accounting for drift is like measuring your blood pressure once at 30 and assuming it’s still accurate at 45.
Key Risk Data Points Every Investor Should Know
| Risk Factor | Data Point | Source |
|---|---|---|
| Equity volatility (Nifty 50) | 18–22% annualised | Historical market data |
| Debt instrument volatility | 3–6% annualised | Historical market data |
| COVID 2020 Nifty drawdown | ~38% peak to trough | NSE data |
| Annual drift without rebalancing | 10–20% equity increase over 5 years | Vanguard Research |
| Sector concentration without rebalancing | 30–40% above target | Morningstar 2023 |
| Rebalancing return premium | 0.4–0.6% per year | T. Rowe Price Research |
The numbers make the case clearly: calculating portfolio risk is not a one-time event. It is an ongoing process.
If you’re still building your first portfolio, start here before thinking about risk management.
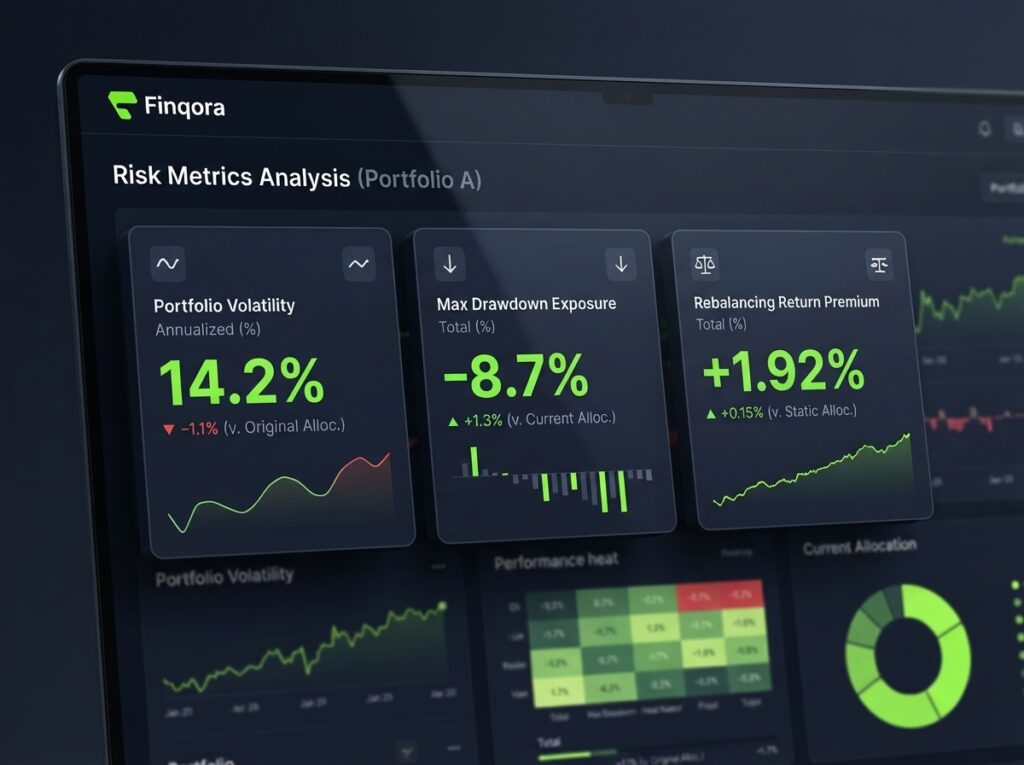
How to Detect Allocation Drift in Your Portfolio
The challenge with allocation drift is that it’s invisible without the right tools. Most investors check their portfolio’s total value — not its internal composition.
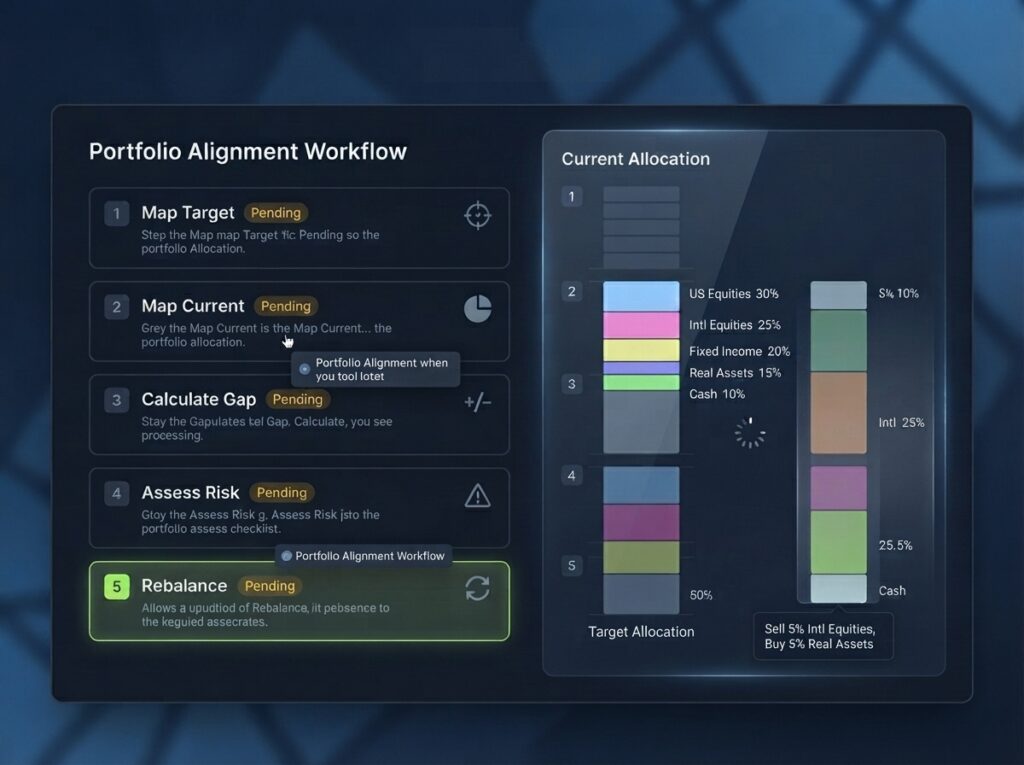
The 5-Step Drift Detection Process
| Step | Action | What to Look For |
|---|---|---|
| Step 1 | Map your original target allocation | Your intended % for each asset class |
| Step 2 | Map your current actual allocation | Current value of every holding by category |
| Step 3 | Calculate the gap | Any category drifted more than 5% from target |
| Step 4 | Assess the risk impact | Has equity exposure increased? Are defensive holdings lower? |
| Step 5 | Rebalance if needed | Add to underweighted categories or shift existing holdings |
The challenge is that this process, done manually across multiple platforms and asset types, is time-consuming and easy to get wrong. This is exactly where AI-powered tools change the equation.
How Much Drift Is Too Much?
A common rule of thumb used by financial planners:
| Drift Amount | Action Required |
|---|---|
| Less than 3% from target | No action needed — within normal range |
| 3–5% from target | Monitor closely, review next quarter |
| 5–10% from target | Rebalance recommended |
| More than 10% from target | Rebalance immediately — risk profile has changed significantly |
Why Most Investors Don’t Catch Drift Until It’s Too Late
There are three main reasons investors miss allocation drift:
Fragmented Portfolios
Stocks on one platform, mutual funds on another, FDs somewhere else, crypto in a third app. Without a consolidated view, calculating portfolio risk across all holdings is genuinely difficult.
Checking Value, Not Composition
Most portfolio apps show you total value and daily returns. Very few show you a clear, real-time breakdown of allocation by asset class — the number that actually tells you about risk.
Infrequent Reviews
A survey by Dalbar found that individual investors tend to review their portfolios 3–4 times a year at most, and rarely with a structured allocation check. By the time drift is noticed, it’s often already significant.
| Review Frequency | Drift Detection Rate | Risk of Significant Drift |
|---|---|---|
| Monthly | High — caught early | Low |
| Quarterly | Moderate — usually manageable | Moderate |
| Annually | Low — often significant by now | High |
| Never / Irregular | Very low | Very High |
Finqora was built specifically to address this. By consolidating all your holdings across 23 asset categories into one portfolio view, it makes detecting drift — and calculating portfolio risk — something you can do in minutes rather than hours.
AI is increasingly becoming the most practical tool for ongoing portfolio risk management
The Bottom Line
Allocation drift isn’t dramatic. It doesn’t trigger alerts or send notifications. It just quietly happens — month by month, fund by fund — until one day your portfolio carries significantly more risk than you ever intended.
Calculating portfolio risk once when you build your portfolio is not enough. Risk needs to be monitored over time, because portfolios are living things that change even when you make no active decisions.
The investors who consistently manage risk better aren’t necessarily smarter. They’re just the ones who check their actual allocation regularly — not just their total returns — and rebalance before drift becomes a problem.
That’s the habit worth building. And the earlier you start, the less catching up you’ll need to do.
Finqora shows your complete portfolio allocation across 23 asset categories in one clear view — so you can detect drift, calculate your real risk exposure, and make better decisions without the spreadsheet nightmare.
Leave a Reply